Introduction
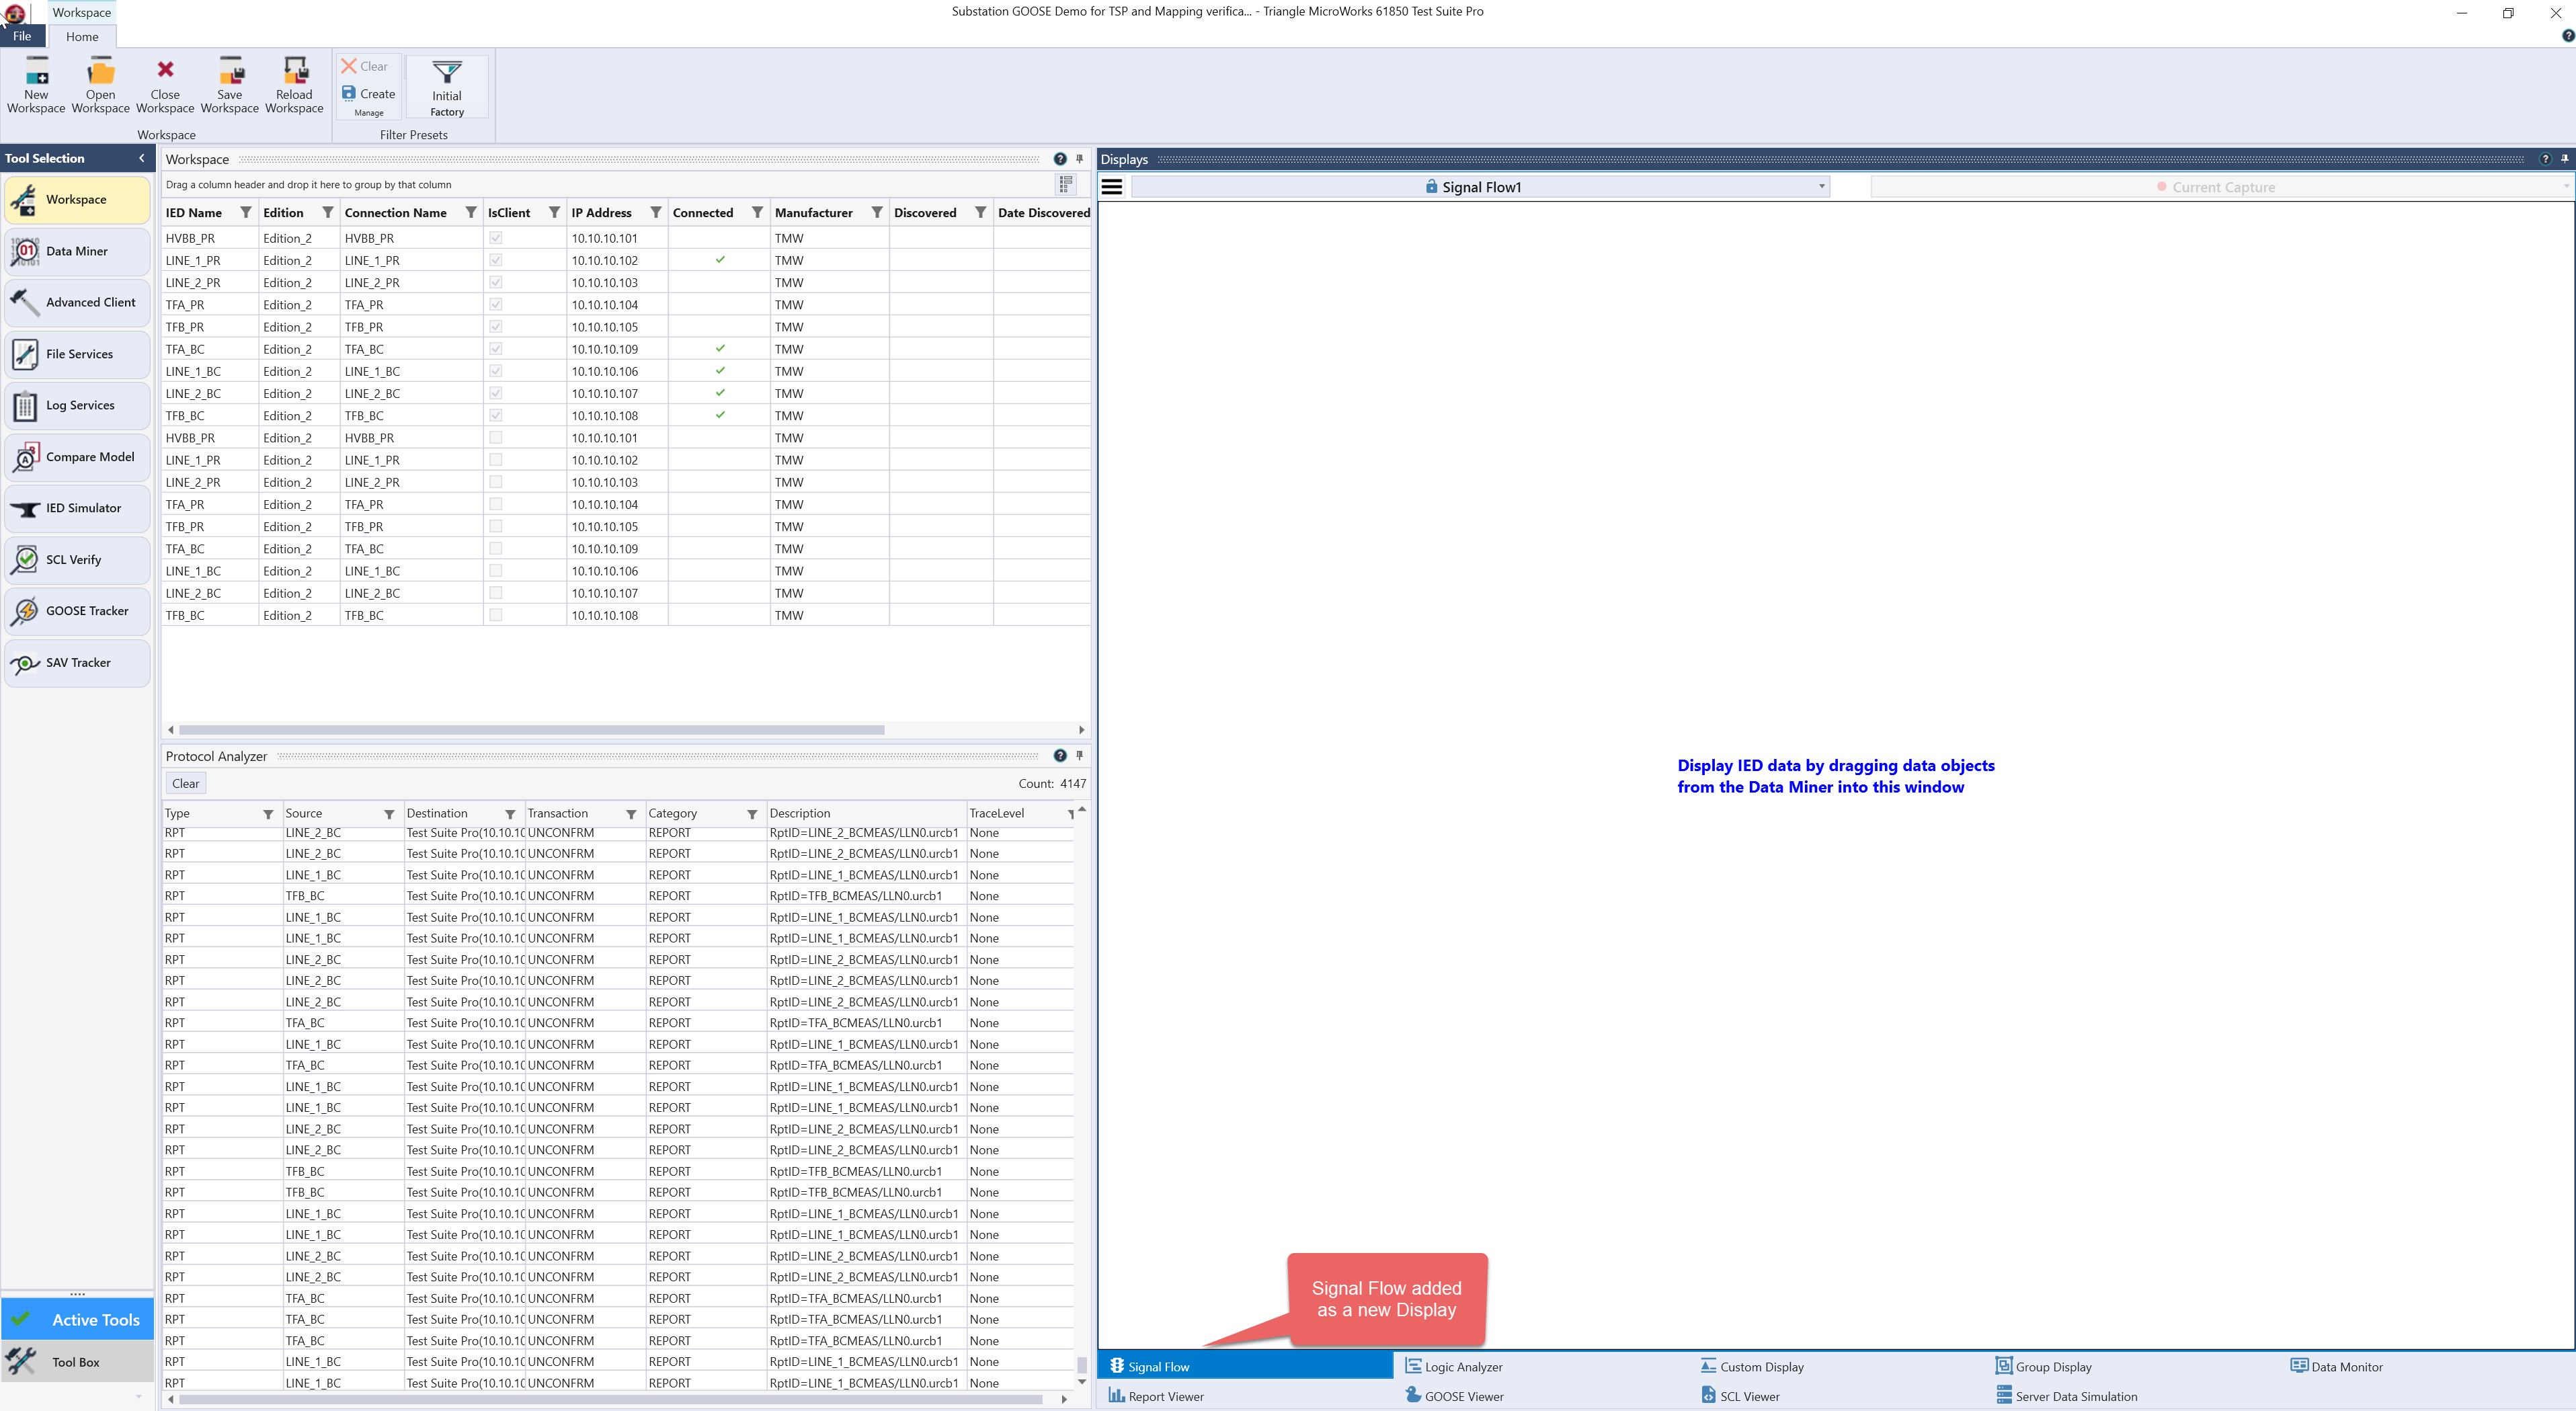
The Signal Flow Display is a visual representation of how a change in a data attribute triggers changes in other logical nodes in the same device (via Reports or GOOSE) or other devices (via GOOSE). When a new workspace is created, it contains an empty Signal Flow Diagram. Nodes are added to the Signal Flow by dragging them from the Data Miner .